
Customer Churn Prediction & Revenue-Recovery Analytics
A leakage-safe XGBoost churn model on synthetic retail data that quantifies revenue-at-risk and ranks retention interventions by ROI.
Built by priyanka · AI Engineering Associate
The system, up close
Real captures from the running system — the demo, screenshots and architecture come first, then the deep dive.
Demo
Walkthrough of the churn pipeline and the client-facing recovery analysis.
The demo walks through prediction, revenue-at-risk and intervention ranking.
Why this needed to be built
Meridian Retail Group saw a 14% drop in repeat-purchase rate over two quarters despite stable traffic — leadership suspected silent churn among mid-value customers who stop buying without complaining.
They needed to predict churn early enough for retention to work, quantify the revenue at risk, and know which intervention pays back — all explainable and auditable for an internal team.
What we built, and how it changes the workflow
We built an end-to-end, leakage-safe churn-analytics pipeline on a synthetic 6,000-customer dataset (fixed seed 42) that benchmarks XGBoost against a recency baseline, estimates revenue-at-risk, and ranks interventions by scenario ROI.
Thirteen monthly time-based snapshots avoid future leakage; RFM and support/marketing features are computed only from history. XGBoost (threshold 0.63, chosen on validation) beats the recency baseline on PR-AUC (0.374 vs 0.209) and F1 (0.418 vs 0.289).
Revenue at risk = P(churn) × 60-day value proxy, surfacing high-value high-risk customers. An observational matched-cohort causal analysis and a scenario ROI model (no invented campaign cost) rank Discount / Loyalty Nudge / Personal Outreach. All data is synthetic (seed 42) — a methodology demonstration, not real Meridian figures.
Core design principle
- No feature uses information unavailable at the prediction date (per-feature leakage audit)
- Time-based split, never random shuffle — reflects real train-on-past / deploy-on-present use
- Reproducible end to end from a single master seed
What it can do
A focused set of capabilities that define the system — no marketable filler, only what actually runs.
Leakage-safe feature engineering
RFM, marketing and support features bounded to history with an explicit KEEP/REMOVE audit.
Churn definition
Eligible active customers; churn = zero purchases in next 60 days (~9.6% prevalence at latest snapshot).
XGBoost vs recency baseline
Benchmarked on PR-AUC, ROC-AUC, precision, recall, F1, Brier, precision@k.
Revenue-at-risk
P(churn) × 60-day value proxy to prioritize high-value high-risk customers.
Causal / uplift analysis
Observational matched-cohort ATT with covariate balance checks (CI includes 0).
Scenario ROI
Ranks interventions by assumed capture rates and contact costs — no fabricated campaign spend.
Reproducibility
A single MASTER_SEED reproduces byte-identical CSVs.
The end-to-end workflow
The system processing path, in order.
- 1
Generate synthetic data
Four connected CSVs (customers, transactions, marketing, support) over 18 months, seed 42.
- 2
Audit & define churn
Data-quality audit and an empirically validated churn definition.
- 3
Time-based split
13 monthly snapshots → 60% train / 20% val / 20% test, no shuffle across time.
- 4
Engineer & model
Leakage-safe features; recency baseline + XGBoost; threshold picked on validation.
- 5
Evaluate
PR-AUC / ROC-AUC / precision / recall / @k on TEST, scored once.
- 6
Revenue & ROI
Revenue-at-risk and scenario ROI from the frozen pipeline; a client deck summarizes it.
Stack & tech choices
- Language & ML
- Python, XGBoost, scikit-learn, pandas, NumPy
- Explainability
- SHAP (scaffolded)
- Causal
- Propensity-score matching (observational)
- Notebooks
- Jupyter (data audit, EDA, modeling, causal, ROI)
Tested, verified and honestly scoped
Validation & tests
TEST metrics are from a real executed run (not invented); synthetic-data caveats are documented throughout.
- XGBoost PR-AUC 0.374 vs recency baseline 0.209; F1 0.418 vs 0.289
- Precision@k: top 10% of TEST = 0.446 precision / 0.354 recall
- Churn prevalence ~9.6% at latest snapshot (matches the brief's ~9%)
- Causal ATT 95% CI includes 0 — reported as observational, not proof of causation
Security & hardening
- No real customer data used — fully synthetic
- Referential integrity verified (0 orphaned rows)
- Leakage audit explicitly documents excluded future-knowledge features
Honest limitations
Customer Churn Prediction & Revenue-Recovery Analytics is an internally developed engineering prototype. We state limitations rather than overclaim production readiness.
- All data synthetic (seed 42) — methodology demo, not real findings
- Synthetic loyalty tier is fixed, not time-varying (documented caveat)
- No campaign cost in data — actual ROI cannot be estimated, only scenarios
Deep-dive references
Where this can go next
Realistic next steps we've scoped — not aspirational marketing copy.
- Add an inventory / stockout table to test product-availability-driven churn
- Double-ML or instrumental-variable causal approach if a real instrument exists
- Drift monitoring so the client team knows when to retrain
Have a similar workflow?
Zenera Labs can build a custom version for your business.
This is one of priyanka's internally developed systems. Tell us about your requirement and we'll scope a tailored build around it.
Other systems we've built internally
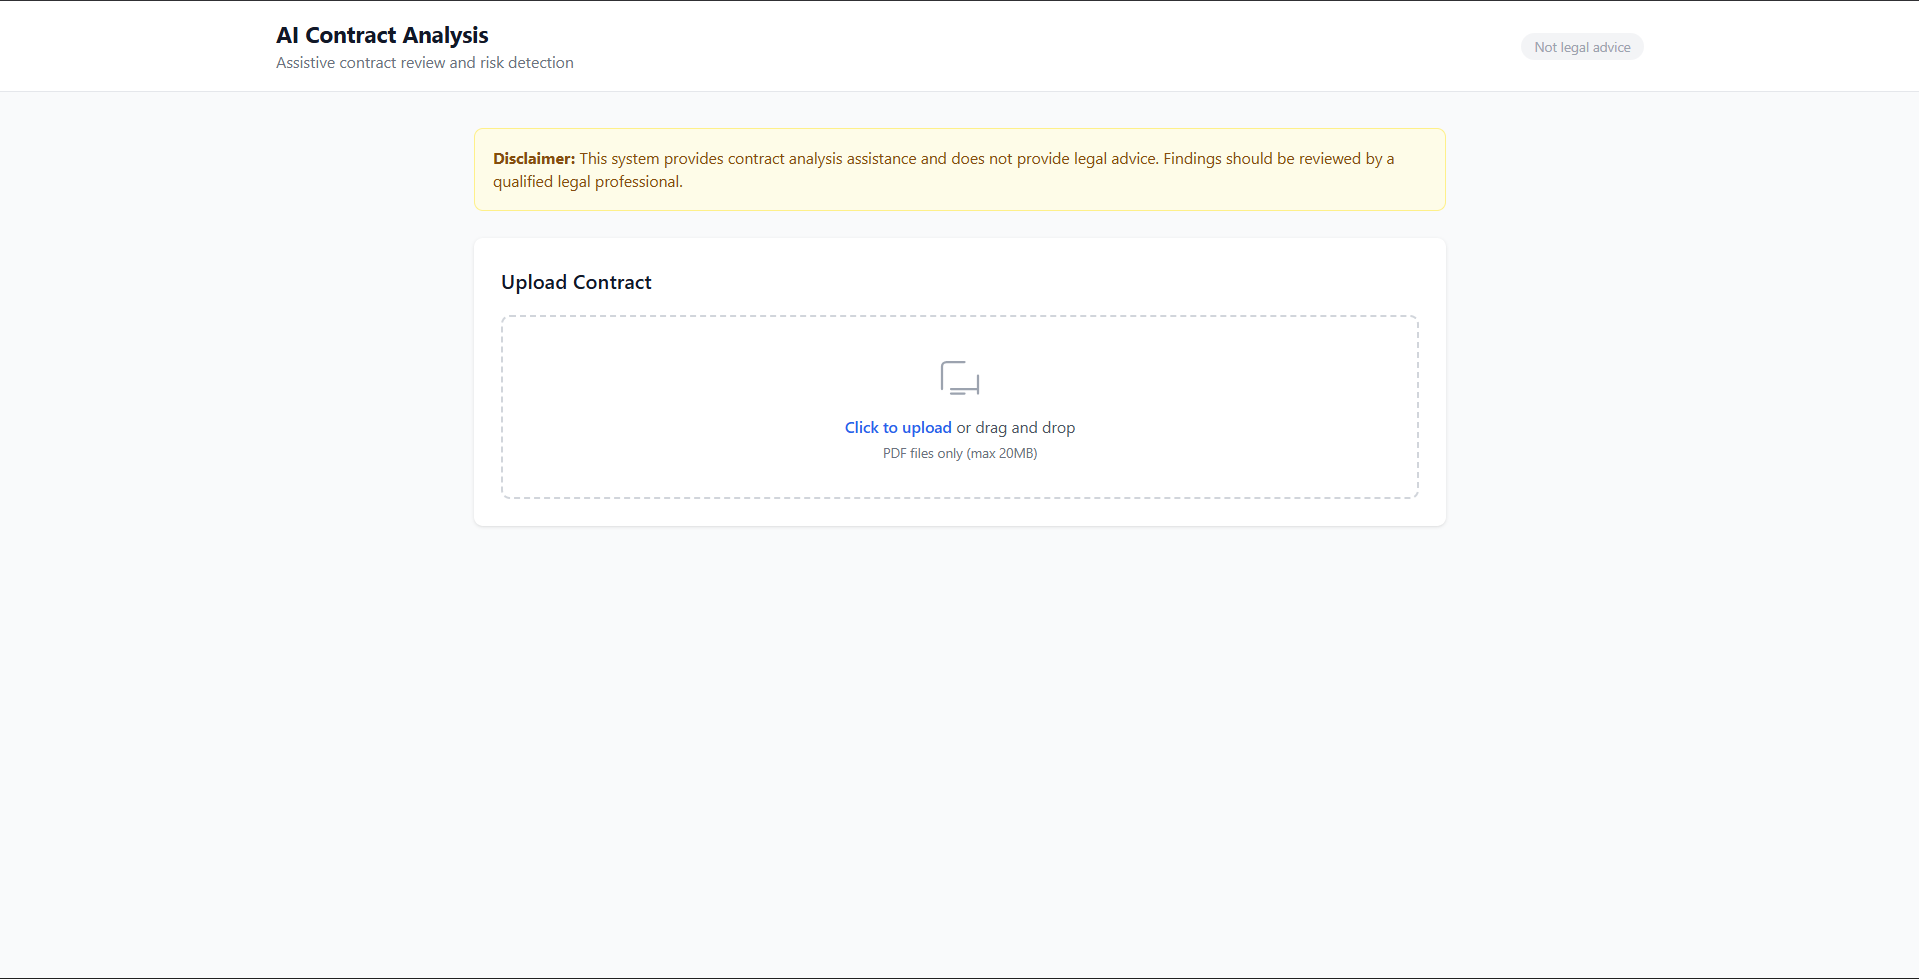
AI Contract Analysis & Risk Detection
Faster document review with traceable evidence — upload a contract and get risk findings with source-verified citations.
naman · Engineering Portfolio
View case study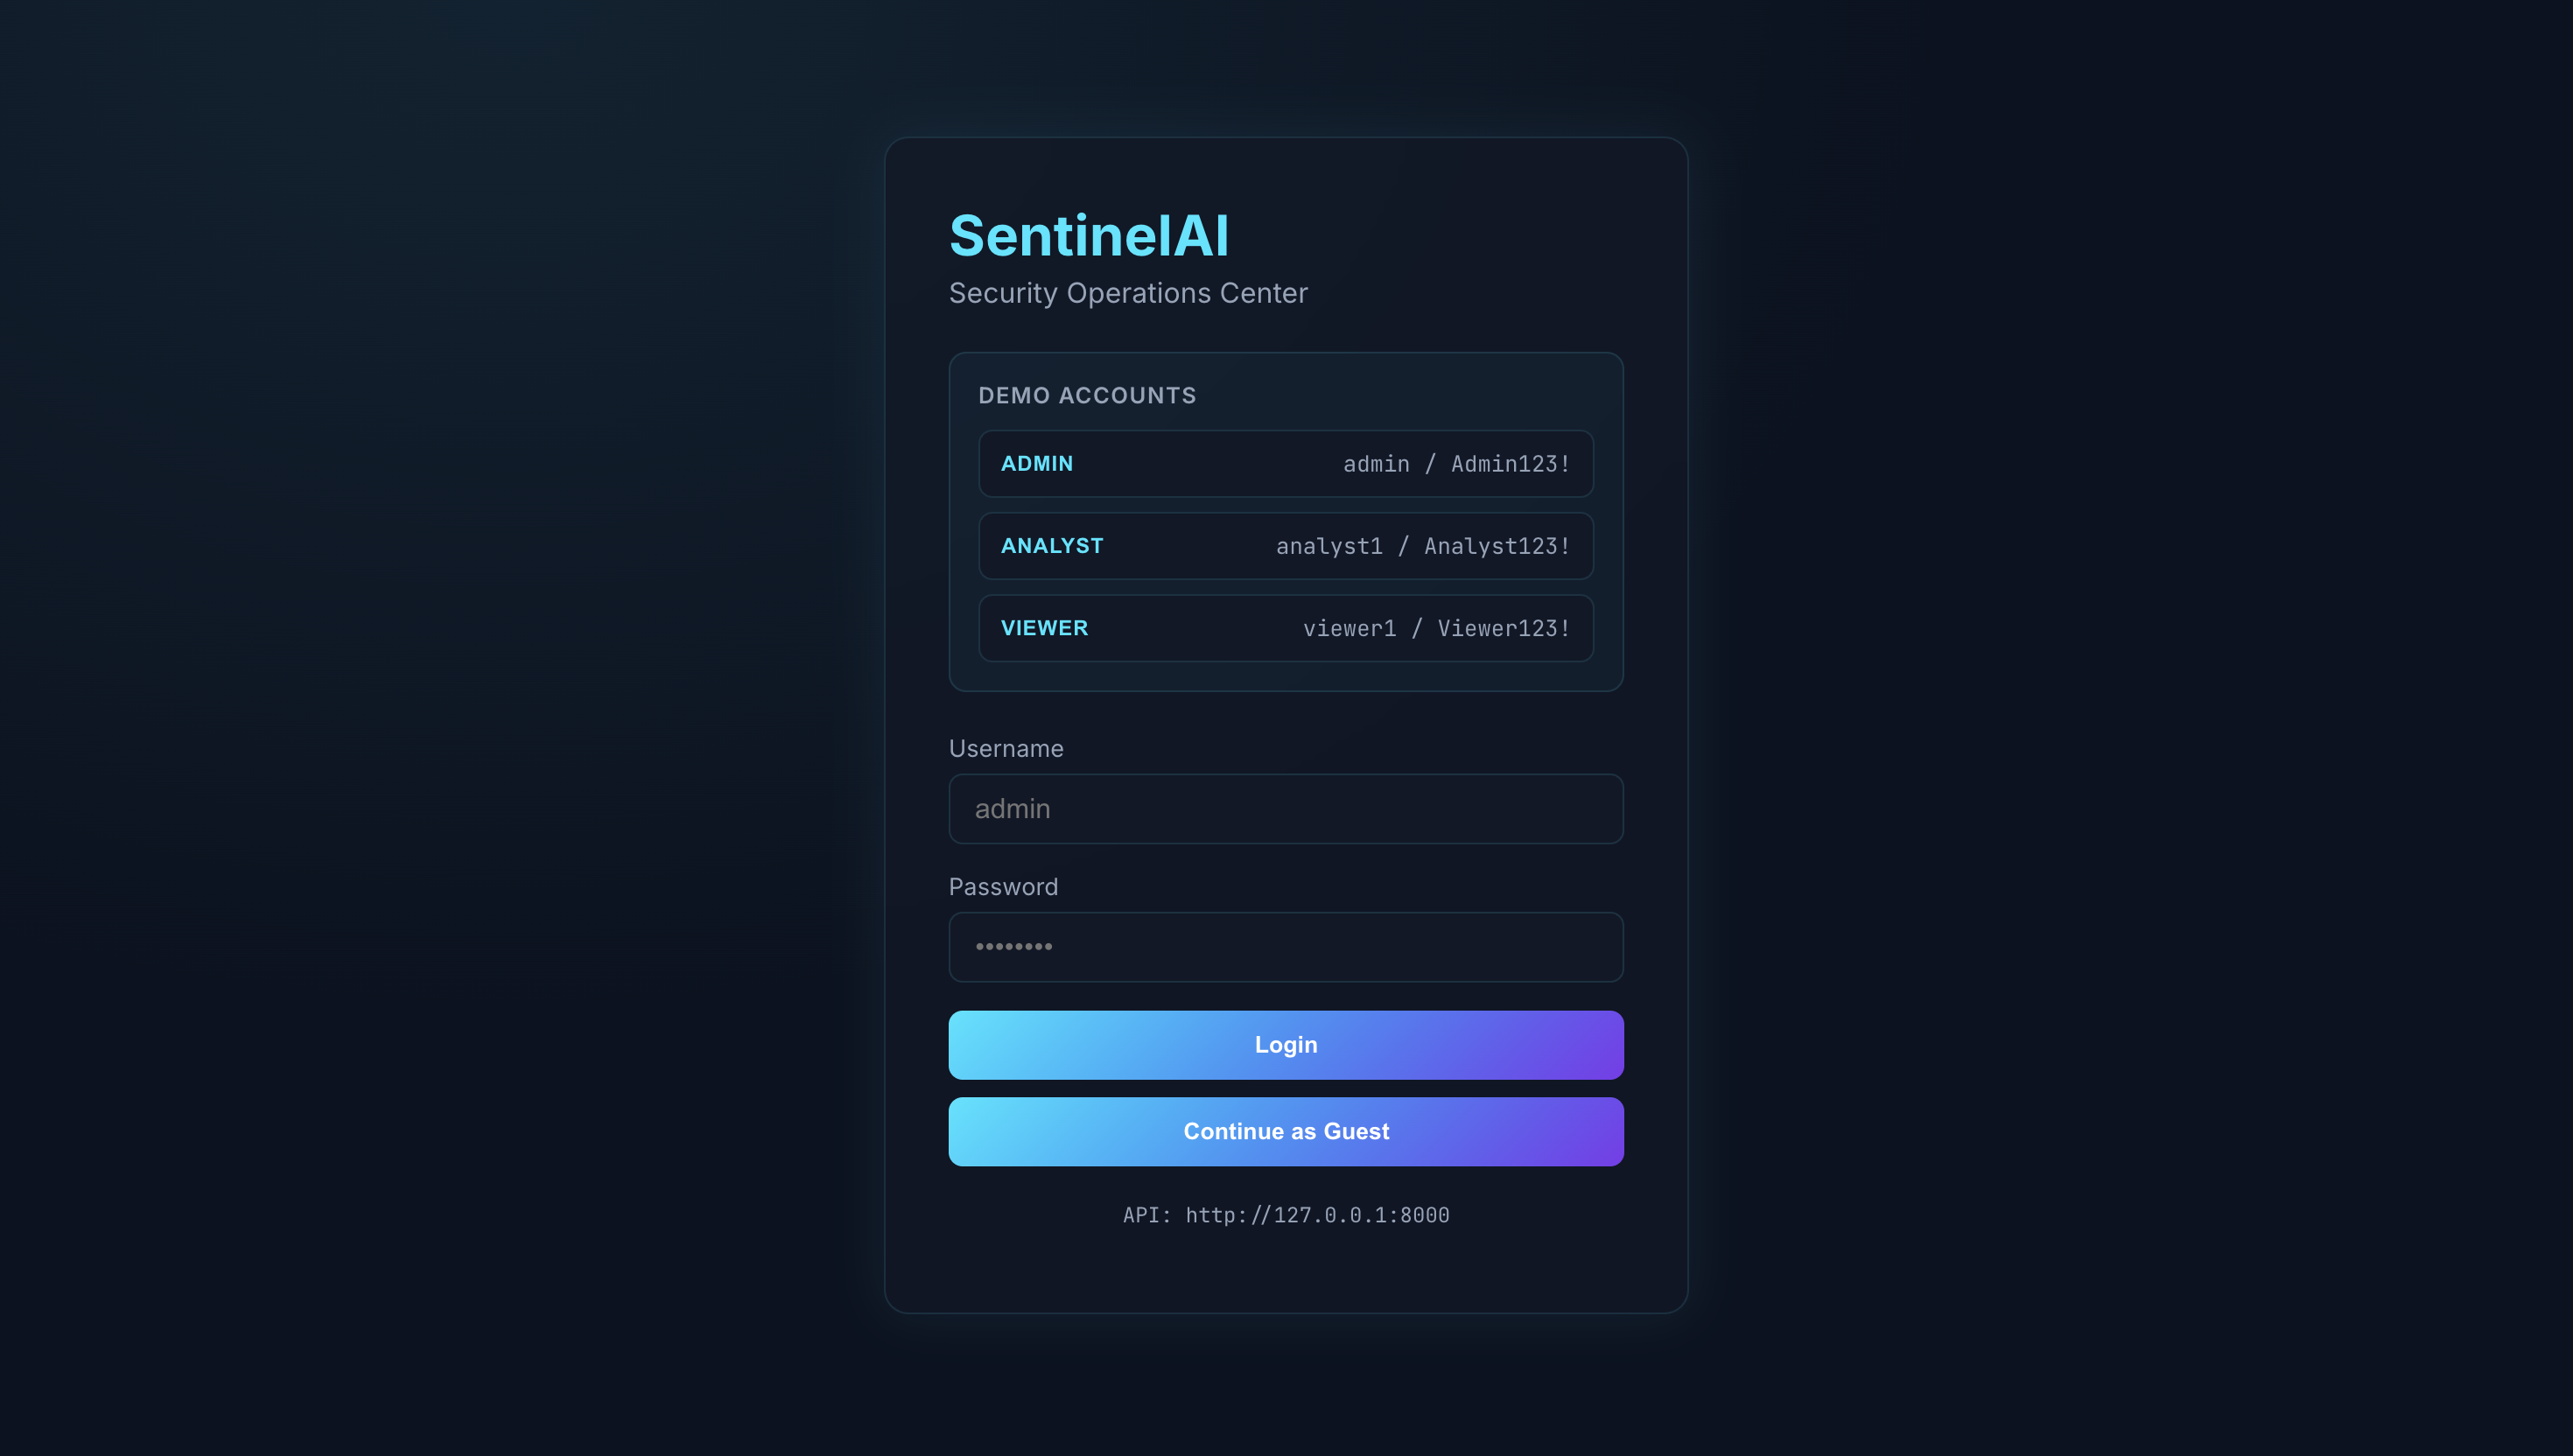
SentinelAI — Security Log Anomaly Detection
Risk-scored alerts from security events — a full-stack Mini-SIEM with ML detection, attack-chain correlation and explainable alerts.
pragna · Engineering Portfolio
View case study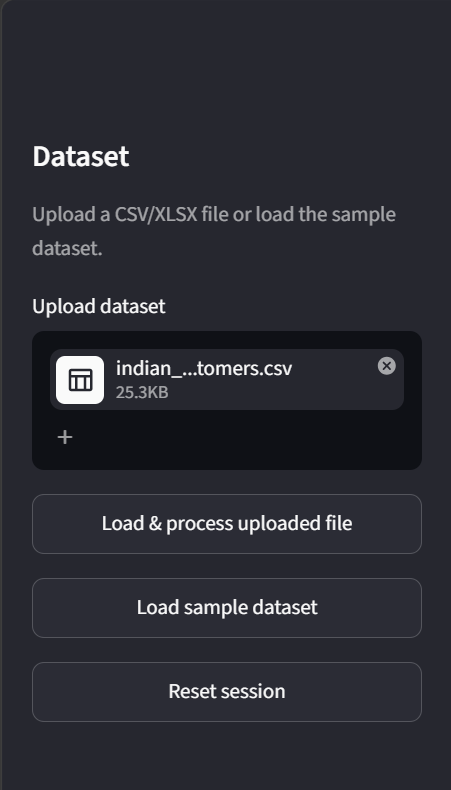
AI Data Analyst & Business Intelligence Agent
Evidence-grounded business intelligence from spreadsheets — upload CSV/XLSX, get analysis, visualizations and explained answers.
priyanka · Engineering Portfolio
View case study