
AI Data Analyst & Business Intelligence Agent
Evidence-grounded business intelligence from spreadsheets — upload CSV/XLSX, get analysis, visualizations and explained answers.
Built by priyanka · ML Engineer & Data Analyst Intern
The system, up close
Real captures from the running system — the demo, screenshots and architecture come first, then the deep dive.
Demo
A demo of the AI Data Analyst interface built on Streamlit — from dataset upload through grounded answers and report export.
Two demo recordings are included — a full workflow and an explained walkthrough.
Screenshots
Architecture
Why this needed to be built
Businesses often store valuable information in spreadsheets and structured datasets — but extracting useful answers from that data usually requires manual preparation, analysis and interpretation.
Non-technical users need an assistant that can accept structured data, validate and clean it, profile its quality, run descriptive analysis, generate visualizations, answer natural-language questions and export a business-ready report.
What we built, and how it changes the workflow
We built an AI-assisted analytics platform that combines deterministic analytics with an LLM interpretation layer, so business users can move from raw data to meaningful insights and recommendations.
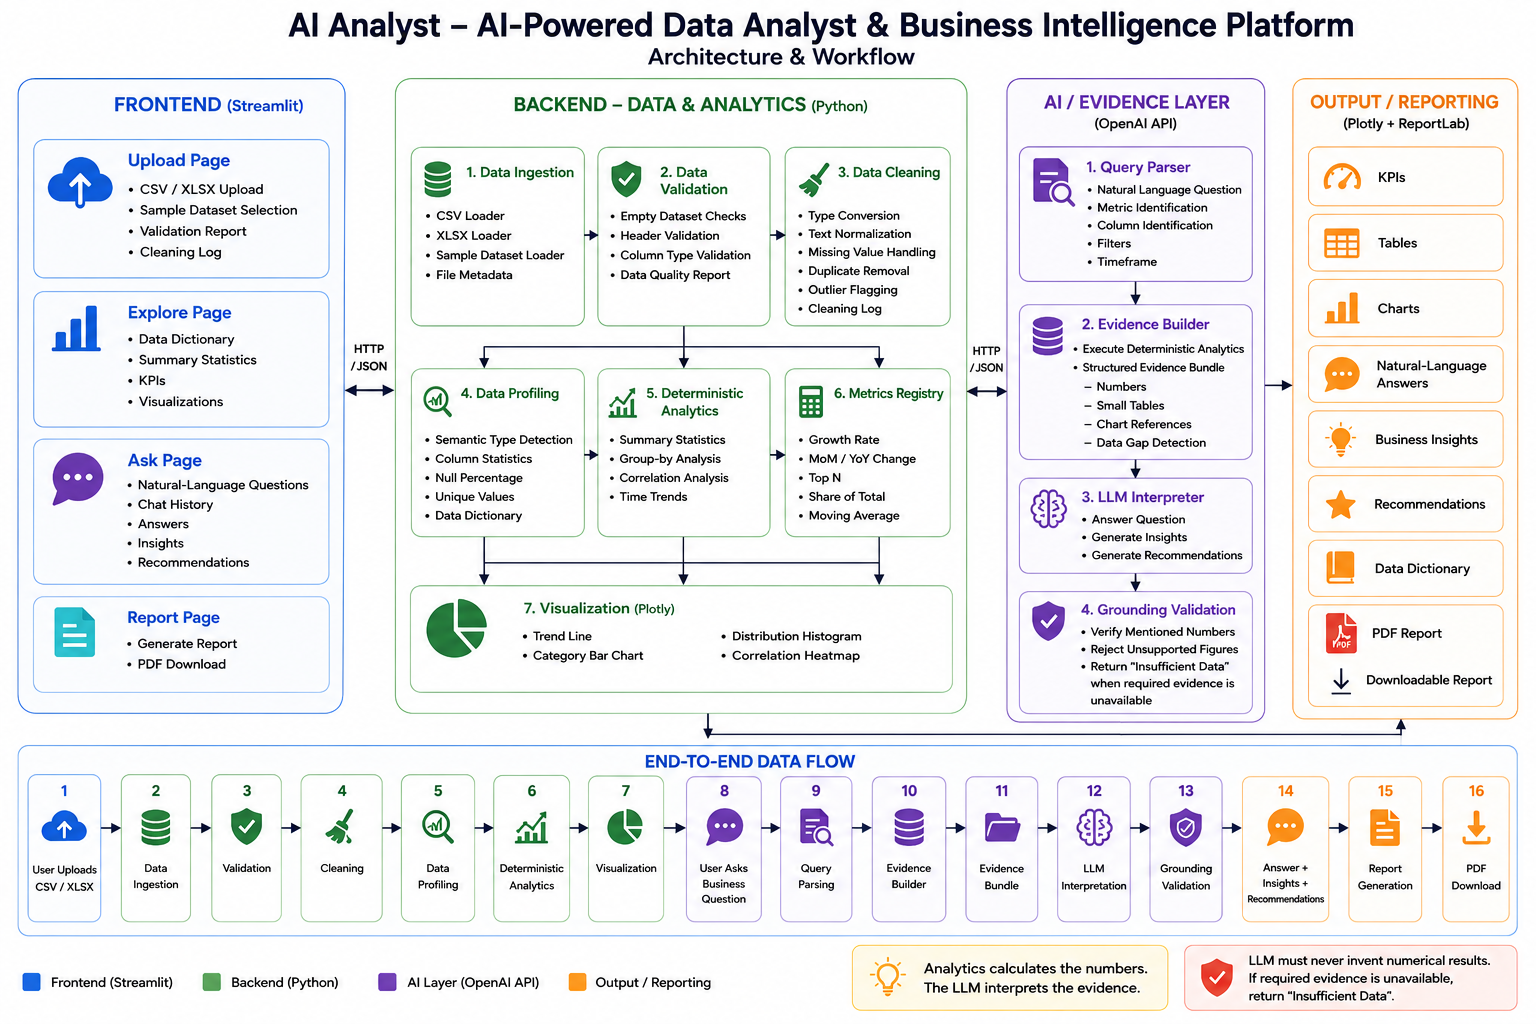
The design follows one strict rule: analytics calculates the numbers, the LLM interprets the evidence. Metrics are computed deterministically with Pandas and NumPy before any result is handed to the LLM, so the AI can never invent numbers.
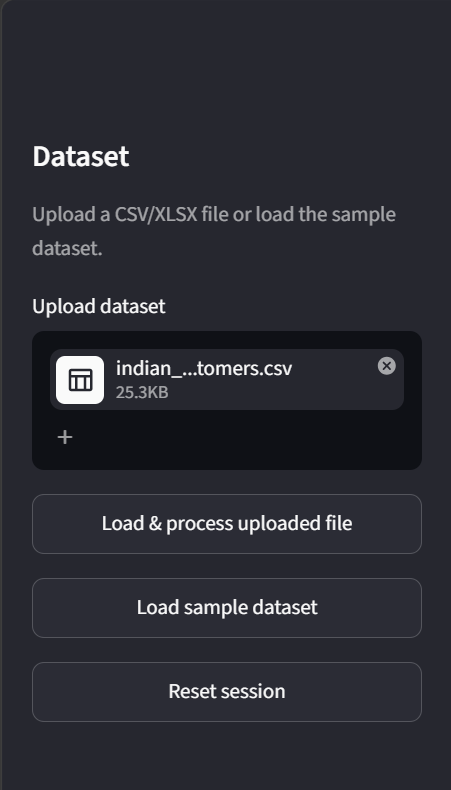
Users upload a CSV or XLSX (or use the bundled sample dataset, indian_saas_customers.csv), the system cleans and profiles it, generates Plotly visualizations, answers natural-language questions with computed evidence, produces insights and recommendations, and exports a PDF report via ReportLab.
Core design principle
- Analytics calculates the numbers. The LLM interprets the evidence.
- The LLM is never the source of numerical truth — it receives computed evidence and is instructed to use only that evidence, avoid inventing metrics and state clearly when information is unavailable.
- Build the reliable analytics foundation first, then add AI on top of verified evidence.
What it can do
A focused set of capabilities that define the system — no marketable filler, only what actually runs.
CSV / XLSX ingestion
Upload structured business data or load the bundled sample dataset (indian_saas_customers.csv — 300 Indian SaaS customers).
Validation & cleaning
Missing values, duplicates and invalid structures are detected and handled.
Data profiling
Rows, columns, types, quality metrics, unique values and a clear data dictionary.
Deterministic analytics
Revenue, profit, orders, customers, average order value, profit margin and category/region/time breakdowns.
Visualizations
Revenue trend, revenue by category, profit by region and profit-margin-by-product charts via Plotly.
Natural-language questions
Ask “Which category generated the highest revenue?” and get a computed answer.
Grounded LLM interpretation
The model explains results strictly from the supplied evidence.
Insights & recommendations
Business observations and recommendations supported by the available analysis.
Report export
A downloadable analytical report generated with ReportLab.
The end-to-end workflow
The system processing path, in order.
- 1
Upload
CSV/XLSX dataset or the bundled sample (indian_saas_customers.csv, 300 customers) is accepted.
- 2
Validate
Structure, types and completeness are checked.
- 3
Clean
Cleaning log records every correction applied.
- 4
Profile
Data dictionary and quality summary are generated.
- 5
Calculate metrics
Deterministic business metrics are computed with Pandas/NumPy.
- 6
Chart & tabulate
Plots and analytical tables are generated.
- 7
Ask a question
The user asks a business question in natural language.
- 8
Compute evidence
A deterministic evidence bundle is built for the question.
- 9
Interpret
The LLM explains the evidence in business language.
- 10
Insights
Practical observations are derived from the analysis.
- 11
Recommendations
Next-step suggestions grounded in computed results.
- 12
Export
A summary report is downloaded.
Stack & tech choices
- Language
- Python 3.10+
- Web application
- Streamlit
- Data processing
- Pandas
- Numerical analysis
- NumPy
- Visualization
- Plotly
- LLM
- OpenAI API
- Report generation
- ReportLab
- Testing
- Pytest
- Version control
- Git / GitHub
Tested, verified and honestly scoped
Validation & tests
The system is designed and tested against representative scenarios covering happy paths, failure handling and numerical correctness.
- Happy path — upload, validation, cleaning, profiling, analytics, visualization, business questions, grounded AI interpretation and report generation
- Failure & edge cases — empty files, unsupported file types, missing values, duplicate records, invalid data, missing metrics, unsupported questions and LLM/API failures
- Numerical answer verification — computed metrics are the source of truth
- Example questions — highest-revenue category, highest-profit region, monthly revenue change, low-margin products, business recommendations
Security & hardening
- API keys stored through environment variables
- No credentials committed to GitHub; .env excluded via .gitignore
- .env.example provided as a configuration template
- Only authorized, owned or sandboxed data used during development
Honest limitations
AI Data Analyst & Business Intelligence Agent is an internally developed engineering prototype. We state limitations rather than overclaim production readiness.
- Initial MVP focuses on structured business datasets
- Multiple datasets, automatic chart selection, forecasting, anomaly detection, conversational follow-ups and SQL database support are stretch features
- ReportLab PDF is the current export format
Deep-dive references
Documentation
Supporting references including a ready-to-use sample dataset so the workflow can be tried end to end.
Where this can go next
Realistic next steps we've scoped — not aspirational marketing copy.
- Forecasting
- Anomaly detection
- Automatic chart recommendations
- Multiple dataset analysis
- Conversational follow-up questions
- SQL database integration
- Additional business domains
Have a similar workflow?
Zenera Labs can build a custom version for your business.
This is one of priyanka's internally developed systems. Tell us about your requirement and we'll scope a tailored build around it.
Other systems we've built internally
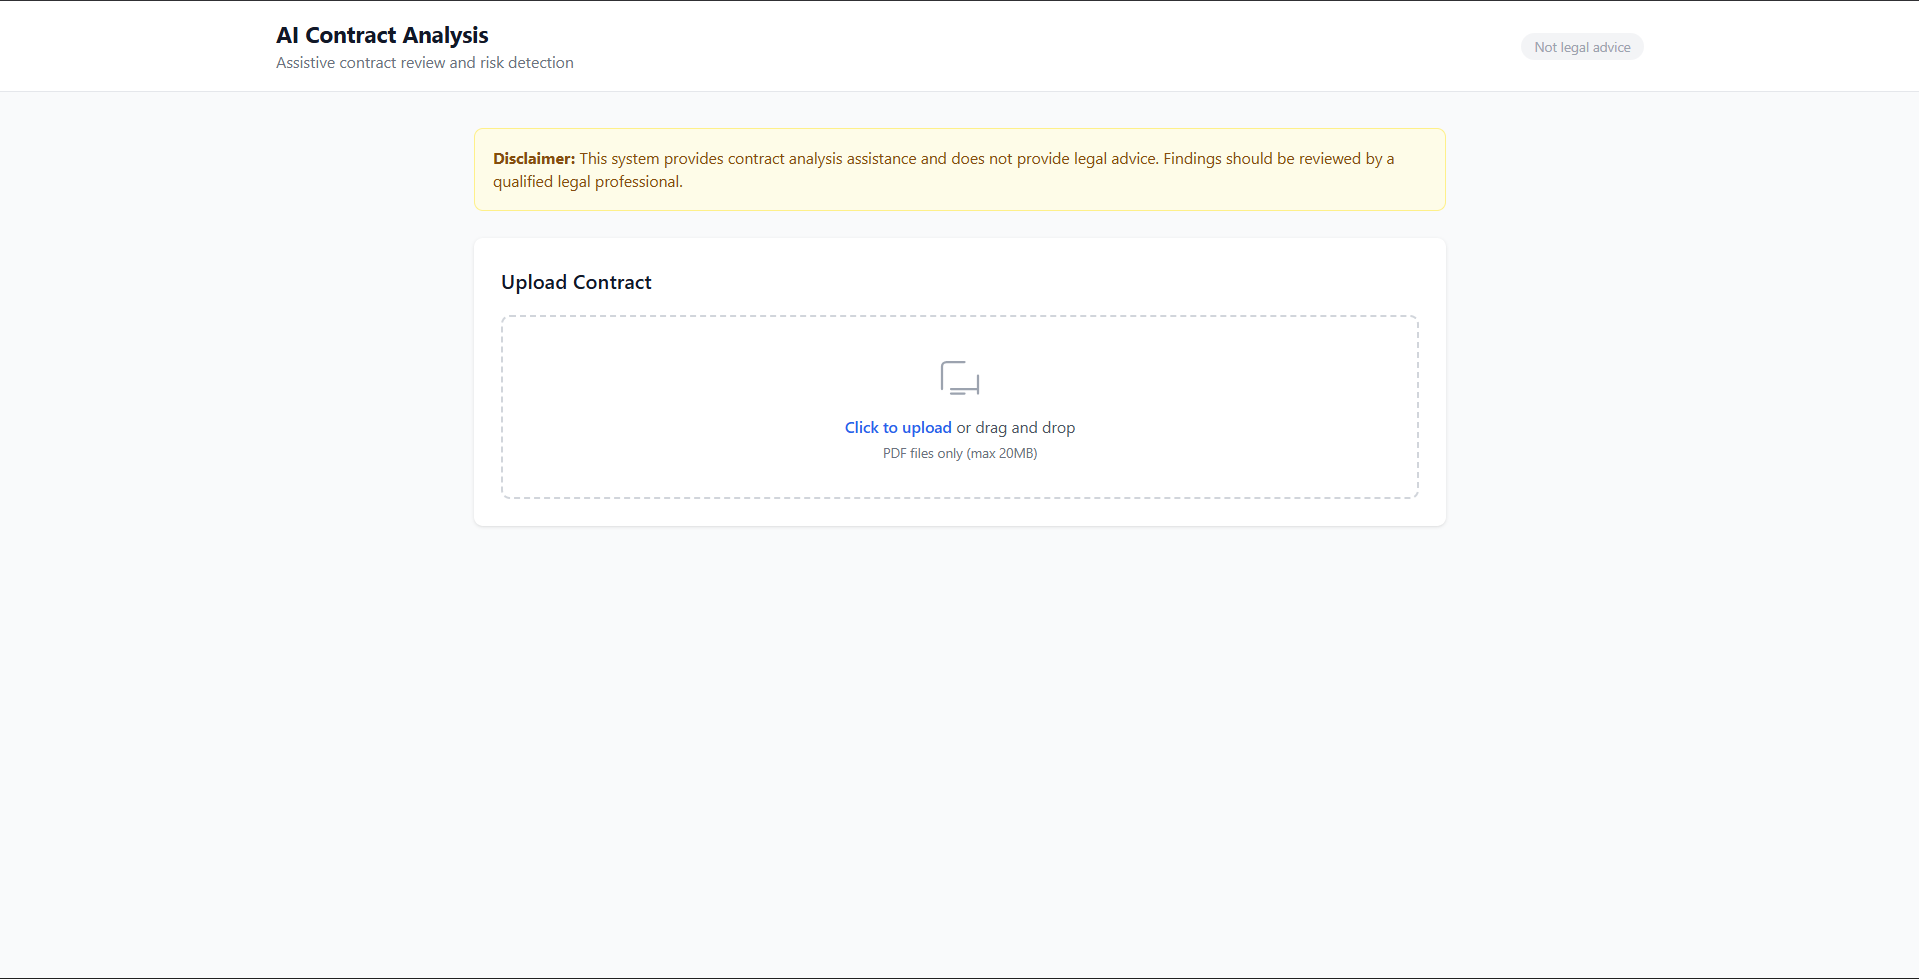
AI Contract Analysis & Risk Detection
Faster document review with traceable evidence — upload a contract and get risk findings with source-verified citations.
naman · Engineering Portfolio
View case study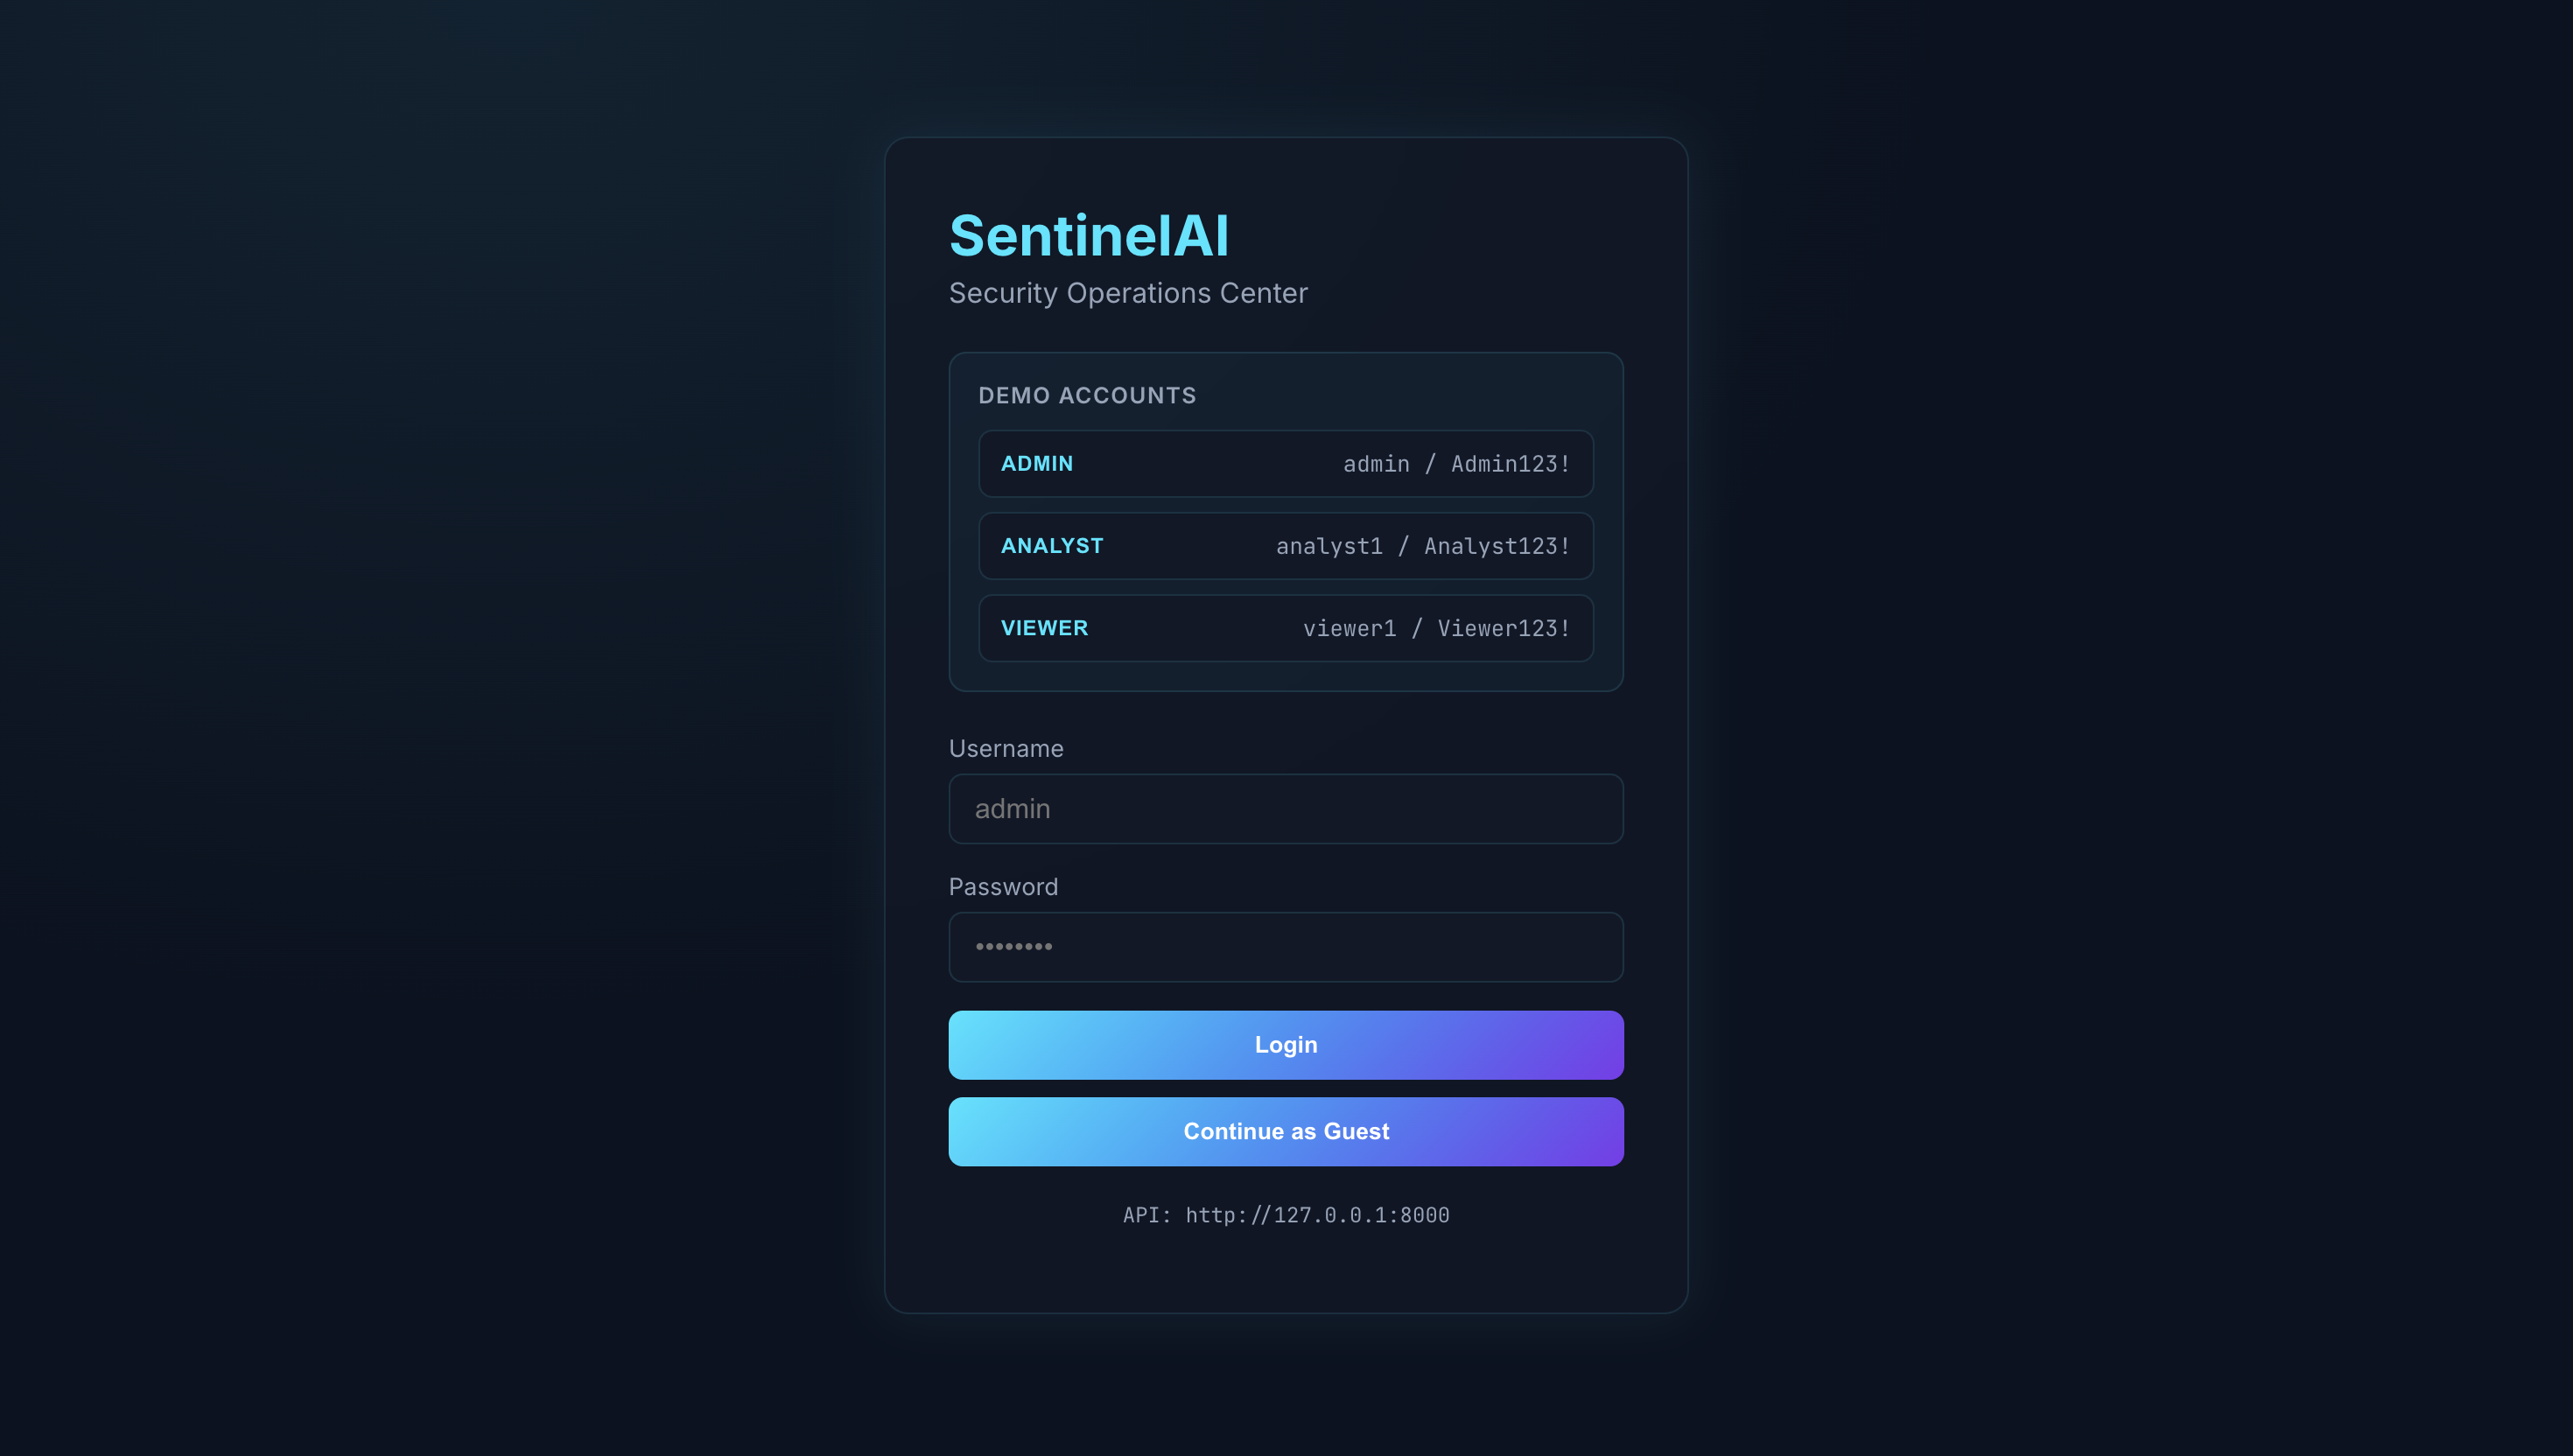
SentinelAI — Security Log Anomaly Detection
Risk-scored alerts from security events — a full-stack Mini-SIEM with ML detection, attack-chain correlation and explainable alerts.
pragna · Engineering Portfolio
View case study
Natural Language → SQL Analytics Assistant
Ask business data questions in plain English — get safe, validated SQL with grounded explanations.
naman · Engineering Portfolio
View case study